Company update| Luggage
June 4, 2018
Safari Industries
BUY
CMP
`612
Growth momentum to continue..
Target Price
`720
Robust Q4FY2018 results- For Q4FY2018, Safari Industries (Safari ) posted a growth
Investment Period
12 Months
of 26%/150% yoy growth in revenue/ PAT amid ~543 bps yoy expansion in operating
margin expansion. The company is gaining market share especially from the
Stock Info
unorganized players and seeing good demand in its backpacks and new categories
Sector
Luggage
which is driving such strong growth in its financials.
Market Cap (` cr)
1,362
Key takeaways from the management meet
Net Debt (` cr)
52
-Safari expects to double its revenue in next 2-2.5 years (~2x of industry growth rate)
Beta
0.3
by gaining market share in the value retailing segment and better product mix. It is
52 Week High / Low
2.9
also improving its distribution network across all channels.
Avg. Daily Volume
13,212
Face Value (`)
2
-It has set up a 30 designers team in China which helps in procuring latest designs in
BSE Sensex
35,227
luggage from China.
Nifty
10,696
-Operating leverage would boost its overall margins in coming years while 3-6% price
Reuters Code
SAFA.BO
hike by Chinese vendors may put some short-term pressure amid falling rupee rate,
Bloomberg Code
SII.IN
unless price hike is taken.
-It provides free replacement warranty up to 10 years for any manufacturing defect
which is garnering very good response from dealers and customers.
Shareholding Pattern (%)
Promoters
57.8
-It wants to build up sizable volume base before foraying into premium category.
MF / Banks / Indian Fls
17.9
-Its Indian capacities (~20-25% of revenue) is increased by 50% in FY2018 and
FII / NRIs / OCBs
4.3
would further be increased due to massive demand for Poly Carbonate products.
Indian Public / Others
20.0
-It sold ~ 3.1 mn pieces in FY2018 and expects to cross 4 mn in FY2019.
Outlook and Valuation: We came convinced about its long term growth story as the
Abs. (%)
3m 1yr
3yr
company is in a sweet spot in the fast growing luggage industry. We are expecting a
BSE 200
1
11
31
CAGR of ~25%/40% in revenue/ earnings over FY18-20E. The stock has given 15%
Safari
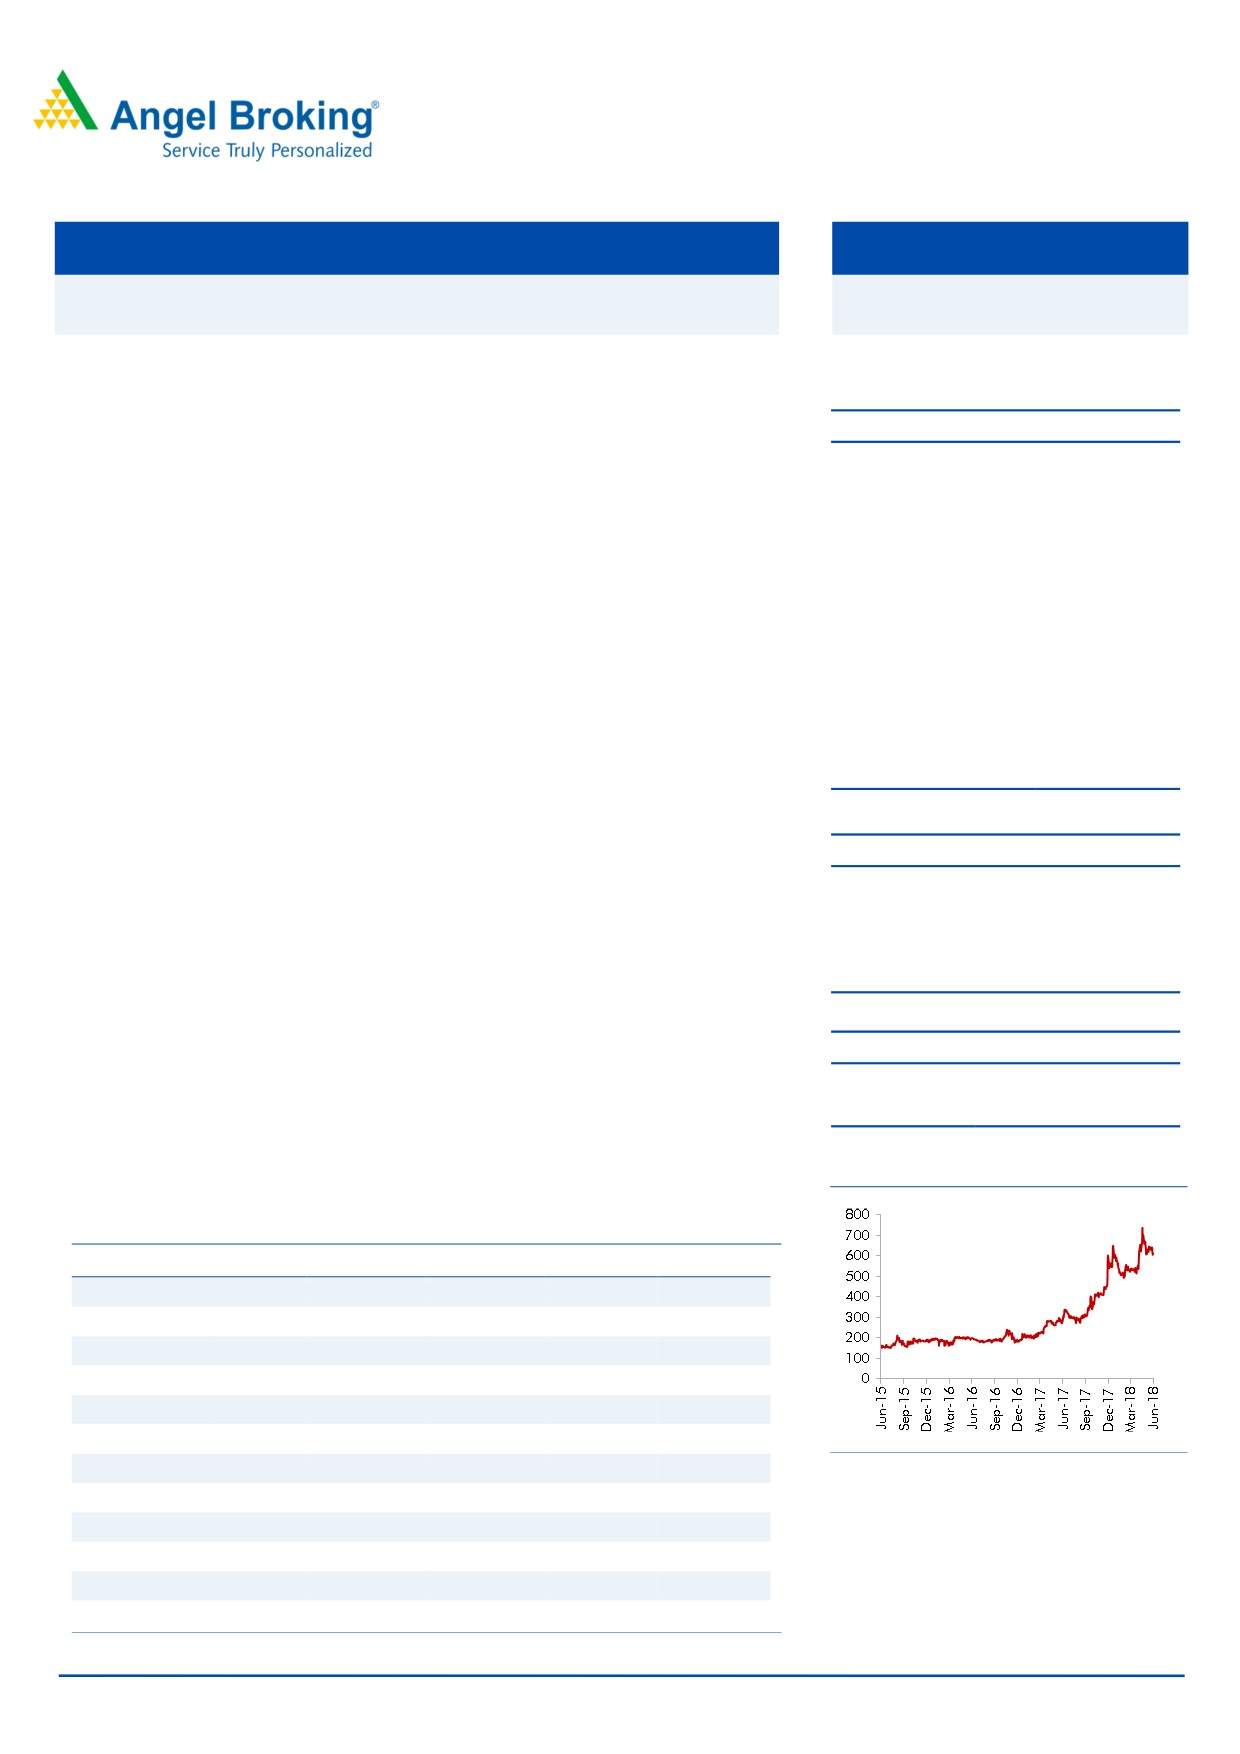
15
118
279
return since our initiation in April. It is currently trading at 33x FY2020 earnings which
still looks attractive in view of its strong growth trajectory. Hence, we recommend BUY
3 year daily price chart
with a target price of `720 (38x FY2020E EPS).
Key Financials
Y/E March (` cr)
FY2016
FY2017E
FY2018E
FY2019E
FY2020E
Net Sales
278
359
415
519
649
% chg
28.8
29.0
15.8
25.0
25.0
Net Profit
7.8
10.4
19.1
30.7
41.8
% chg
55.9
33.8
83.4
60.7
36.1
OPM (%)
6.7
6.3
9.3
10.5
11.0
EPS (Rs)
3.5
4.7
9.5
13.8
18.8
P/E (x)
175.0
130.8
64.2
44.4
32.6
Source: Company, Angel Research
P/BV (x)
15.0
13.6
7.9
6.8
5.7
Nidhi Agrawal
RoE (%)
8.5
10.4
11.0
15.3
17.5
022-39357800 Ext: 6872
RoCE (%)
9.7
12.1
14.3
18.5
21.5
EV/Sales (x)
5.1
3.9
3.4
2.7
2.1
EV/EBITDA (x)
76.4
62.3
36.6
25.3
19.4
Source: Company, Angel Research
Please refer to important disclosures at the end of this report
1
Safari Industries |Company Update
Exhibit 1: Q4 results at a glance
Rs cr
Q4FY18
Q3FY18 Q4FY17 YoY
QoQ
FY18
FY17
YoY
Net Sales
119
103
95
25.9%
15.3%
415
345
21%
Total expenditure
105
91
89
18.6%
15.7%
375
324
16%
Raw Material Consumed
19
9
10
86.5%
119.6%
42
32
30%
Stock Adjustment
-12
-13
-15
-19.6%
-9.7%
-19
-18
4%
Purchase of Finished Goods
57
59
57
0.9%
-3.1%
203
187
9%
Employee Expenses
15
13
11
30.9%
14.1%
53
40
31%
Other Expenses
27
24
26
3.6%
11.6%
96
83
16%
Gross margin %
46.6%
47.8%
45.6%
45.7%
41.9%
Operating profit
13.8
12.3
5.8
137%
12.7%
40.8
20.7
97%
Other Income
0.7
0.5
1.3
-47.4%
45.7%
1.5
2.1
-24%
PBIDT
14.5
12.8
7.2
102%
14.0%
42.3
22.8
86%
Interest
0.7
0.9
0.5
39%
-16.8%
2.8
3.6
-22%
PBDT
13.8
11.9
6.7
108%
16.2%
39.5
19.1
107%
Depreciation
1.4
2.0
1.4
4%
-28.3%
6.1
5.1
20%
PBT
12.4
9.9
5.3
135%
25.2%
33.4
14.0
138%
Tax
4.3
3.3
1.9
133%
29.7%
12.0
5.0
140%
Adjusted Profit
7.7
6.8
3.1
150%
12.9%
21.2
9.5
125%
OPM %
11.6%
11.9%
6.2%
9.8%
6.0%
PAT margin %
6.4%
6.6%
3.2%
5.1%
2.7%
Tax rate %
34.7%
34%
35.0%
36.0%
35.7%
Source: Company
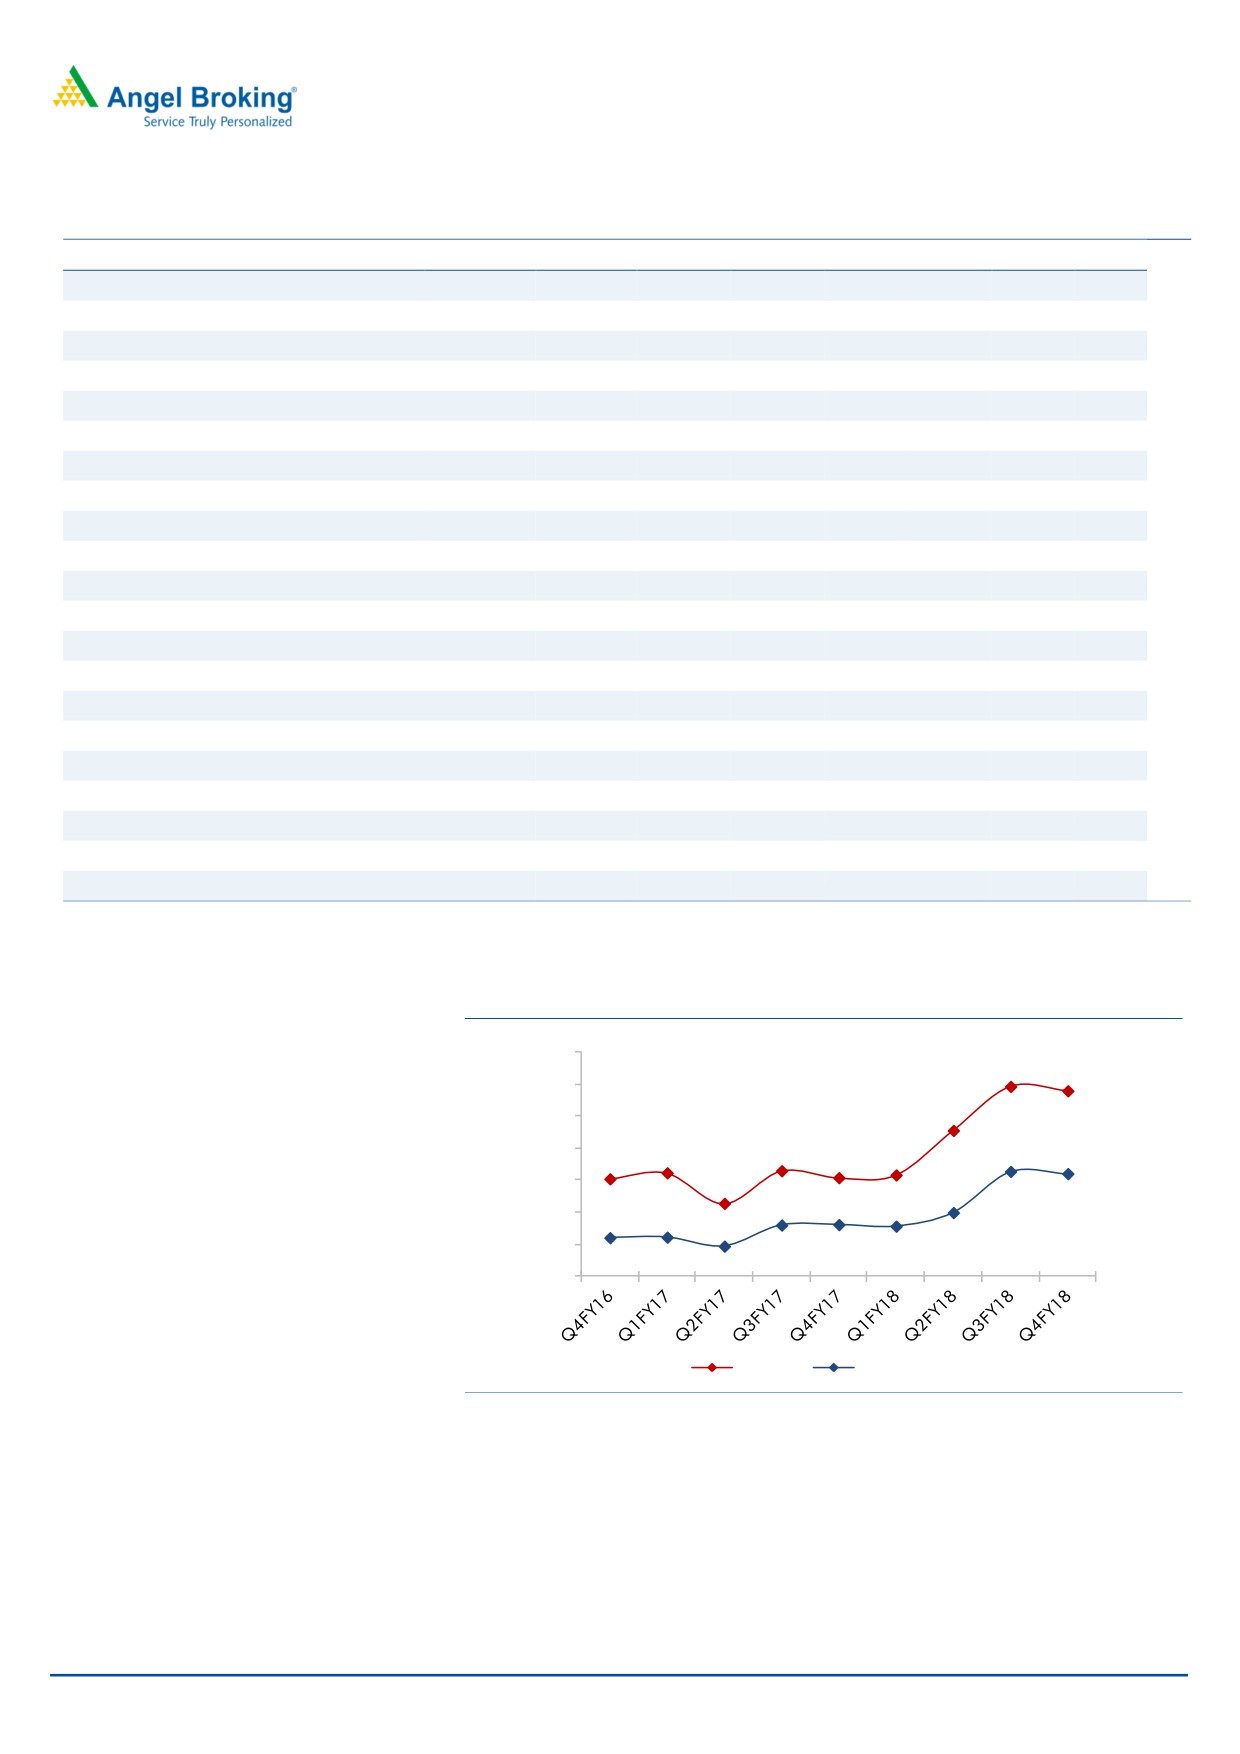
Exhibit 2: Margins are on uptrend
14.0%
12.0%
10.0%
8.0%
6.0%
4.0%
2.0%
0.0%
OPM %
PAT margin %
Source: Company, Angel Research
June 4, 2018
2
Safari Industries |Company Update
Outlook and Valuation
We came convinced about its long term growth story as the company is in
sweet spot in a fast growing luggage industry. We are expecting a CAGR of
~25%/40% in revenue/ earnings over FY18-20E. The stock has given 15%
return since our initiation in April and is currently trading at 33x its FY2020
earnings. Hence, we recommend BUY with a target price of `720 (38x
FY2020E EPS).
Risks to our estimates
Volatility in foreign currency could impact the company’s profitability
(80% of its revenue comes from soft luggage, which is imported from
China).
With closure of many luggage units in China (owing to pollution
concerns), the surviving suppliers have started taking price hikes which is
could put pressure on its margins, unless price hike is taken.
Increase in competition from unorganized players would impact overall
growth of the company
Safari’s 20% sales comes from hard luggage segment and any increase
in input cost (most of the key raw material is polypropylene and
aluminum) could negatively impact profitability
June 4, 2018
3
Safari Industries |Company Update
Profit & Loss Statement
Y/E March (` cr)
FY2016
FY2017
FY2018E
FY2019E
FY2020E
Total operating income
278
359
415
519
649
% chg
28.8
29.0
15.8
25.0
25.0
Total Expenditure
260
336
377
465
577
Raw Material
173
219
242
299
370
Personnel
29
41
48
57
71
Selling and Administration Expenses
48.1
65.4
74.8
93.5
116.8
Others Expenses
9
10
12
15
19
EBITDA
19
22
39
55
72
% chg
63.1
21.3
72.0
41.5
30.9
(% of Net Sales)
6.7
6.3
9.3
10.5
11.0
Depreciation& Amortisation
4
5
6
7
7
EBIT
14
17
33
48
64
% chg
70.7
20.0
87.6
47.2
34.2
(% of Net Sales)
5.2
4.8
7.8
9.2
9.9
Interest & other Charges
3
3
3
4
4
Other Income
1
1
2
2
2
(% of PBT)
6.5
7.4
5.0
4.1
3.6
Share in profit of Associates
-
-
-
-
-
Recurring PBT
12
15
31
46
62
% chg
105.9
25.2
108.8
46.7
36.1
Tax
4
5
12
15
21
(% of PBT)
35.2
34.1
38.8
33.0
33.0
PAT (reported)
8
10
19
31
42
Extraordinary Items
(0)
(1)
-
-
-
ADJ. PAT
8
10
19
31
42
% chg
55.9
33.8
83.4
60.7
36.1
(% of Net Sales)
2.8
2.9
4.6
5.9
6.4
Fully Diluted EPS (Rs)
3.5
4.7
9.5
13.8
18.8
% chg
55.9
33.8
103.9
44.6
36.1
Source: Company, Angel Research
June 4, 2018
4
Safari Industries |Company Update
Consolidated Balance Sheet
Y/E March (` cr)
FY2016
FY2017
FY2018E FY2019E FY2020E
SOURCES OF FUNDS
Equity Share Capital
4
4
4
4
4
Reserves& Surplus
87
96
168
196
235
Shareholders’ Funds
91
100
173
201
239
Equity Share Warrants
-
-
-
-
-
Total Loans
58
44
54
57
60
Deferred Tax Liability
-
-
0
-
-
Total Liabilities
149
143
228
258
299
APPLICATION OF FUNDS
Gross Block
42
45
60
70
80
Less: Acc. Depreciation
18
22
28
35
42
Net Block
24
23
31
35
37
Capital Work-in-Progress
0
1
0
1
1
Investments/ Other NC assets
0
-
6
-
-
Current Assets
143
165
244
286
337
Inventories
76
94
123
150
184
Sundry Debtors
54
58
104
85
107
Cash
5
5
3
32
23
Loans & Advances
8
7
2
2
3
Other Assets
-
-
13
16
20
Current liabilities
27
54
53
64
77
Net Current Assets
116
110
190
222
261
Deferred Tax Asset
(0)
(0)
-
-
-
Total Assets
149
143
228
258
299
June 4, 2018
5
Safari Industries |Company Update
Consolidated Cashflow Statement
Y/E March (` cr)
FY2016 FY2017 FY2018E FY2019E FY2020E
Profit before tax
12
15
33
46
62
Depreciation
4
5
6
7
7
Change in Working Capital
0
0
(79)
3
(47)
Interest / Dividend (Net)
3
3
3
4
4
Direct taxes paid
(4)
(5)
(12)
(15)
(21)
Others
(28)
4
42
2
0
Cash Flow from Operations
(13)
22
(6)
46
6
(Inc.)/ Dec. in Fixed Assets
(16)
(5)
(5)
(10)
(10)
(Inc.)/ Dec. in Investments
1
(1)
0
0
0
Cash Flow from Investing
(15)
(6)
(5)
(10)
(10)
Issue of Equity
7
0
0
0
0
Inc./(Dec.) in loans
3
1
11
3
3
Dividend Paid (Incl. Tax)
0
(16)
(2)
(3)
(4)
Interest / Dividend (Net)
(3)
(3)
(3)
(4)
(4)
Cash Flow from Financing
29
(17)
6
(4)
(5)
Inc./(Dec.) in Cash
1
(2)
(5)
32
(9)
Opening Cash balances
3
4
5
0
32
Closing Cash balances
4
2
0
32
23
June 4, 2018
6
Safari Industries |Company Update
Key Ratios
Y/E March
FY2016
FY2017
FY2018E
FY2019E
FY2020E
Valuation Ratio (x)
P/E (on FDEPS)
175.0
130.8
64.2
44.4
32.6
P/CEPS
115.3
90.9
49.8
36.3
27.7
P/BV
15.0
13.6
7.9
6.8
5.7
Dividend yield (%)
0.0
0.1
0.1
0.2
0.3
EV/Sales
5.1
3.9
3.4
2.7
2.2
EV/EBITDA
76.4
62.3
36.4
25.4
19.5
EV / Total Assets
9.5
9.8
6.2
5.4
4.7
Per Share Data- `
EPS (Basic)
3.5
4.7
9.5
13.8
18.8
EPS (fully diluted)
3.5
4.7
9.5
13.8
18.8
Cash EPS
5.3
6.7
12.3
16.9
22.1
DPS
0.2
0.4
0.8
1.2
1.6
Book Value
40.9
44.9
77.7
90.3
107.5
Returns (%)
ROCE
9.7
12.1
14.3
18.5
21.5
Angel ROIC (Pre-tax)
10.0
12.5
14.9
21.2
23.3
ROE
8.5
10.4
11.0
15.3
17.5
Turnover ratios (x)
Asset Turnover (Gross Block)
6.6
7.9
7.0
7.5
8.2
Inventory / Sales (days)
100
96
108
106
104
Receivables (days)
71
59
91
60
60
Payables (days)
92
141
110
110
110
Working capital cycle (ex-cash) (days)
80
14
89
56
54
Source: Company, Angel Research
June 4, 2018
7
Safari Industries |Company Update
Research Team Tel: 022 - 39357800
DISCLAIMER
This document is solely for the personal information of the recipient, and must not be singularly used as the basis of any investment
decision. Nothing in this document should be construed as investment or financial advice. Each recipient of this document should
make such investigations as they deem necessary to arrive at an independent evaluation of an investment in the securities of the
companies referred to in this document (including the merits and risks involved), and should consult their own advisors to determine
the merits and risks of such an investment.
Angel Broking Pvt. Limited, its affiliates, directors, its proprietary trading and investment businesses may, from time to time, make
investment decisions that are inconsistent with or contradictory to the recommendations expressed herein. The views contained in this
document are those of the analyst, and the company may or may not subscribe to all the views expressed within.
Reports based on technical and derivative analysis center on studying charts of a stock's price movement, outstanding positions and
trading volume, as opposed to focusing on a company's fundamentals and, as such, may not match with a report on a company's
fundamentals.
The information in this document has been printed on the basis of publicly available information, internal data and other reliable
sources believed to be true, but we do not represent that it is accurate or complete and it should not be relied on as such, as this
document is for general guidance only. Angel Broking Pvt. Limited or any of its affiliates/ group companies shall not be in any way
responsible for any loss or damage that may arise to any person from any inadvertent error in the information contained in this report.
Angel Broking Pvt. Limited has not independently verified all the information contained within this document. Accordingly, we cannot
testify, nor make any representation or warranty, express or implied, to the accuracy, contents or data contained within this document.
While Angel Broking Pvt. Limited endeavours to update on a reasonable basis the information discussed in this material, there may be
regulatory, compliance, or other reasons that prevent us from doing so.
This document is being supplied to you solely for your information, and its contents, information or data may not be reproduced,
redistributed or passed on, directly or indirectly.
Angel Broking Pvt. Limited and its affiliates may seek to provide or have engaged in providing corporate finance, investment banking
or other advisory services in a merger or specific transaction to the companies referred to in this report, as on the date of this report or
in the past.
Neither Angel Broking Pvt. Limited, nor its directors, employees or affiliates shall be liable for any loss or damage that may arise from
or in connection with the use of this information.
Note: Please refer to the important `Stock Holding Disclosure' report on the Angel website (Research Section). Also, please refer to the
latest update on respective stocks for the disclosure status in respect of those stocks. Angel Broking Pvt. Limited and its affiliates may
have investment positions in the stocks recommended in this report.
Disclosure of Interest Statement
Safari Industries Ltd.
1. Analyst ownership of the stock
No
2. Angel and its Group companies ownership of the stock
No
3. Angel and its Group companies' Directors ownership of the stock
No
4. Broking relationship with company covered
No
Note: We have not considered any Exposure below ` 1 lakh for Angel, its Group companies and Directors
Ratings (Returns):
Buy (> 15%)
Accumulate (5% to 15%)
Neutral (-5 to 5%)
Reduce (-5% to -15%)
Sell (< -15%)
June 4, 2018
8